Somebody needs two hundred name badges by Thursday. Or forty certificates, or price tags for a whole product range, or a graphic for every speaker at a conference. The instinct is to open the design, change the name, export, change the name, export, and lose an evening.
There is an old printing idea that solves this completely, it is called mail merge, and it is one of my favorite things to set up because the payoff is so absurdly disproportionate to the effort.
The whole concept
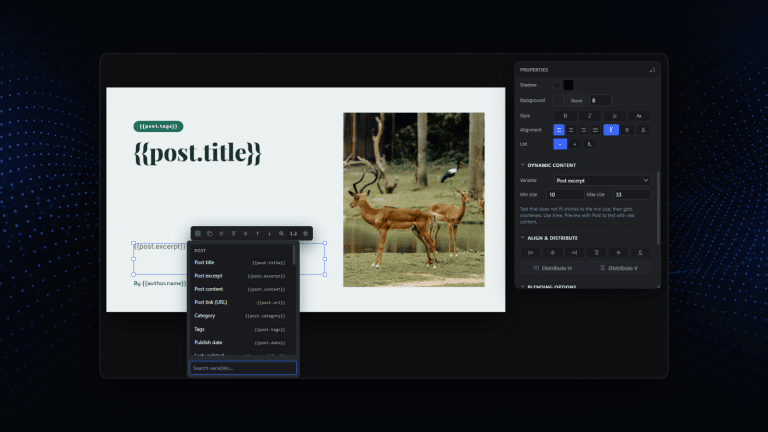
You have one design and a table. Each row of the table is one output. Wherever the design says {{name}}, the generated copy says whatever is in the name column for that row.
That is it. A spreadsheet with two hundred rows becomes two hundred images, each one identical in layout and different in content, and the whole run takes about as long as making three by hand.
What makes it feel like a superpower rather than a gimmick is that the spreadsheet is usually something you already have. The registration list. The product export. The class roster. Somebody has already typed all those names, and typing them a second time into a design tool is pure waste.
Setting it up, start to finish
1. Put placeholders in the design
Type the placeholder directly into the text layer, curly braces and all: {{name}}, {{role}}, {{price}}, {{date}}. Any name works, as long as you can remember it. Style the layer exactly as you want the final text to look, because the style stays and only the words are replaced.
I write the placeholders as realistic dummy content, so {{name}} sits where a name goes and looks roughly the length of a name. It makes the design decisions honest.
2. Make the columns match
Your CSV needs a header row, and the headers need the same names as your placeholders. A column called name feeds {{name}}. That is the entire mapping step, which is why I like it: there is no mapping screen to get wrong.
Export from any spreadsheet as CSV. If you are not sure of the format, grab the sample file that the merge dialog offers and open it, then match its shape.
3. Run it
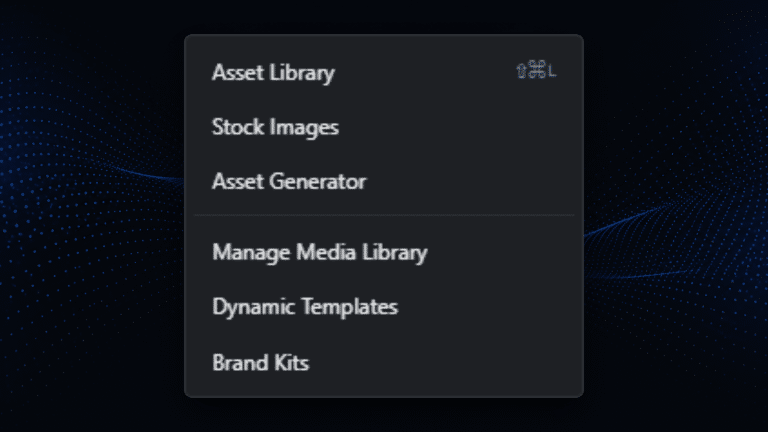
Automation, Images, Generate from CSV. Load the file, choose which column supplies the file name, and go. Every row renders the current document once and saves it to the media library.
Generate from CSV is part of WunderPaint Pro. The placeholders in the text layers work in the free plugin; the run over every row does not.
Pick your file name column carefully. Names are tempting and collide the moment you have two people called Anna. An ID column, or a combination like 2026-badge-0031, sorts properly and never overwrites anything.

The design problems that only show up at scale
This is the part nobody tells you, and it is where the interesting work is.
Names are not the length you designed for. You test with “Anna Meier” and the file contains “Maximilian von Bredow-Hartmann”. Give the text layer a font size range so it shrinks to fit, and check the longest entry in your data before you run. Sorting the spreadsheet by text length for a second takes no time and shows you the worst case immediately.
Empty cells happen. Somebody has no job title. If the layer just disappears when its value is empty, your layout has to still look right without it, which usually means centring the block rather than positioning each line absolutely.
Numbers need formatting before they arrive. A price column will happily contain 19.9 and render as “19.9” instead of “19.90”. Fix that in the spreadsheet, where you have actual formatting functions, rather than trying to solve it in the design.
Accents, umlauts and non-Latin scripts. Save the CSV as UTF-8 and check one row with an accent before you commit to the batch. A run of two hundred badges with mangled characters is a very specific kind of Thursday.
Things I use this for that are not name badges
- Price tags and shelf labels from a product export. The design stays constant, the prices stay current, and reprinting after a price change is a re-run rather than a project.
- Quote cards for social, one per row, from a list of quotes I collect over a month.
- Speaker and session graphics for an event, generated from the same schedule that feeds the website.
- Certificates and course completions, with the date column filled by a formula so it is always correct.
- Team pages, where every person gets an identically framed portrait card.
- Test data for a design, honestly. Thirty rows of realistic content is the fastest way to find out whether a layout actually works.

Do a dry run of three
The one habit worth building: before the full batch, cut the file down to three rows and run those. Pick the shortest entry, the longest entry, and one with an empty cell somewhere.
Those three tell you almost everything that could go wrong across two hundred, and finding it now costs a minute instead of a re-run and a conversation about why the badges have to be reprinted.
Why I keep coming back to it
There is something deeply satisfying about the moment the run finishes and the media library fills up with two hundred correct images. But the real value is subtler: because generating is cheap, you stop rationing.
You make the graphic for every session instead of only the keynote. You reprint the shelf labels when the price actually changes rather than at the end of the quarter. The work stops being a cost you avoid and becomes something you just do, and that changes what you are willing to attempt.